
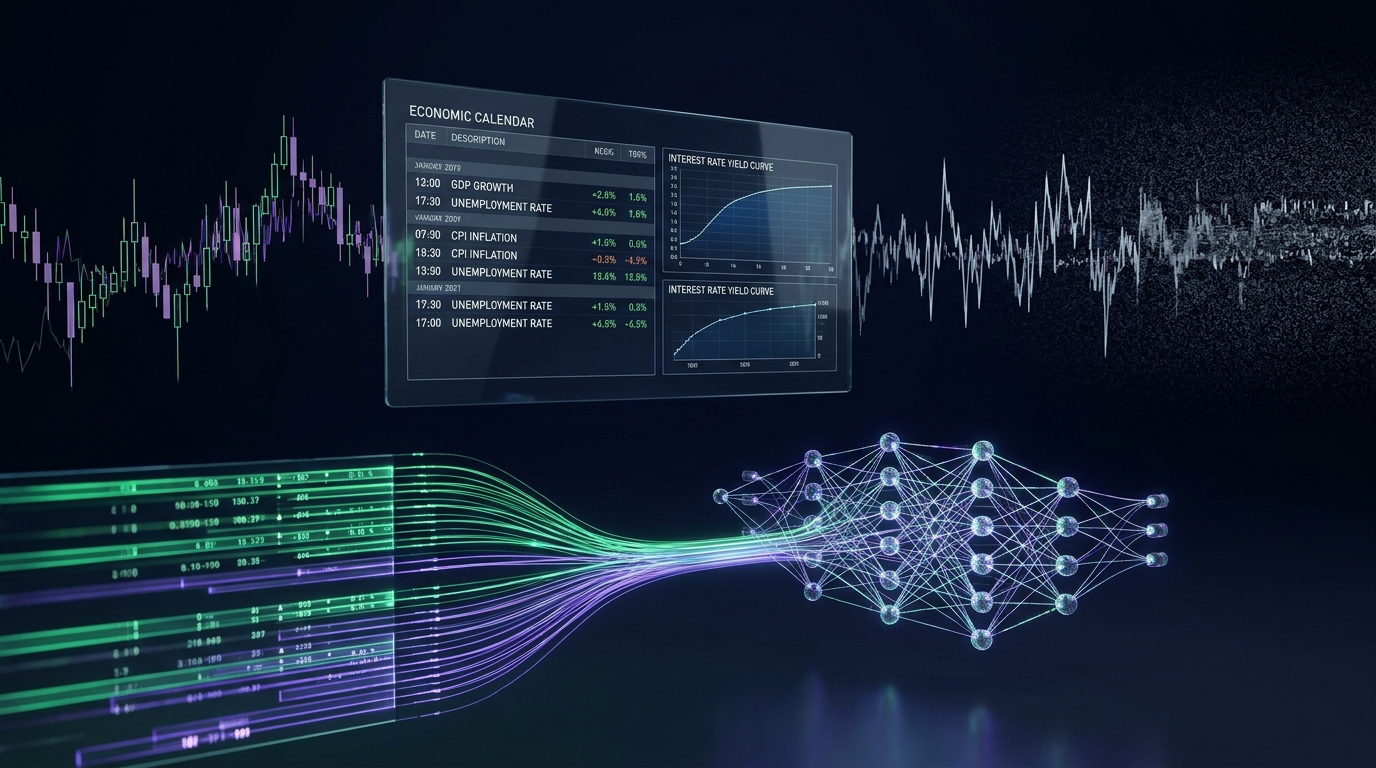
Ask the chart why the price moved
Try something. Open a price chart of the Euro against the Dollar. Pick any big candle. Now ask the chart, out loud, why that candle happened.
The chart will give you the most honest answer it has: “Because the price moved.”
That’s all it knows. A chart is a diary of what price did, with no record of why. And yet most people who try to build a trading robot start there. They take the past prices, add a few indicators, hand it all to a machine learning model, and ask it to predict the next candle.
Then they wonder why it works beautifully on old data and falls apart on a live account.
This article is about a different starting point. Instead of asking the chart what happens next, we ask the world what just happened. That means economic news: jobs reports, inflation numbers, interest rate decisions. It’s called fundamental analysis. And there’s a surprisingly practical reason why it’s easier to work with, whether you’re a human or a machine.
You don’t need to be good at mathematics to follow this. Everything is explained in plain English, and where a number appears, it’s there to make an idea concrete, not to scare you.
What fundamental analysis actually is
Fundamental analysis sounds like something from a university lecture. It isn’t. The idea is simple: currencies move because of what’s happening in the real economy.
Think of a country’s currency as a share in that country’s economy. If the economy looks strong, people want more of it. If it looks weak, they want less. Governments and agencies publish regular reports that measure the economy’s health: how many jobs were created, how fast prices are rising, how much shoppers spent. Traders read those reports, and they adjust their positions.
Here’s the part most beginners miss, and it’s the most important idea in this whole article: The number itself doesn’t move the market. The surprise does.
Imagine the US government announces that the economy created two hundred thousand new jobs last month. Is that good news or bad news for the Dollar?
You can’t answer. You’re missing a piece of information: what did everyone expect?
If professional economists predicted a hundred thousand jobs, then two hundred thousand is a fantastic surprise, and the Dollar jumps. But if they predicted three hundred and fifty thousand, then two hundred thousand is a disappointment, and the Dollar falls. Same number, opposite reaction.
Before every major release, news services survey dozens of professional economists, and the middle of their predictions becomes the “forecast”, also called the consensus. In the minutes before the announcement, big institutions already move their money to match that forecast. So by the time the number appears, the expected part of the news is already built into the price. What’s left to move the market is the gap between what was expected and what was announced. That gap is the surprise.

Hold on to that idea. The rest of this article depends on it.
The problem with teaching a machine to read charts
To see why news data is easier, we first have to understand why chart data is so hard.
Reason one: it’s mostly noise
A photograph of a cat is packed with clear signals: whiskers, ears, fur. Every pixel agrees that it’s a cat. Short-term price movement in a deep, busy market is different. Most of it is random wiggling, caused by banks balancing their books, small orders passing each other, and brief shifts in liquidity. There’s a real signal in there somewhere, but it’s faint.
Think of tuning a radio during a thunderstorm. You’re trying to catch a quiet station fifty miles away. Ninety-nine percent of what you hear is static, and one percent is music. Now suppose you buy a gigantic amplifier and turn the volume to maximum. Do you hear the music better? No. You just blast the static louder. A very powerful machine learning model, trained on noisy price data, behaves like that amplifier. It doesn’t find hidden music. It memorises the static, and then fails when the static changes.
The course puts a number on this. Using a measure called the signal-to-noise ratio, which is simply how much of what you’re looking at is useful, versus how much is random, the analysis estimates that for ordinary chart patterns, the useful part is well under one percent.

Reason two: indicators don’t add information
Almost every technical indicator, whether it’s a moving average, an RSI, or a Bollinger Band, is calculated from past prices. It takes the price history, and turns it into a smoother or more colourful picture of the same history.
A useful comparison is a photograph. You can crop it, blur it, change its colours, or make it black and white. But you can never make it contain more information than the original photo. An indicator does the same thing to prices: it can delay and smooth, but it can’t reveal anything that wasn’t already in the prices. In information theory, this is a proven rule, called the data processing inequality:
In plain English: processing data can’t create new knowledge. So when someone feeds fifteen different indicators into a model, they’re often giving it fifteen blurry copies of the same photograph, and hoping it will see something new.
Reason three: in a busy market, today’s price is already the best guess
In a market as heavily traded as Euro Dollar, the price in five minutes is, to a rough approximation, the price right now, plus randomness. Economists call this a martingale. It simply means that, in an efficient market, simple patterns are discovered and traded away quickly, mainly by very fast computers owned by large firms. Anything that looks like an easy chart pattern tends to be taken apart in fractions of a second.
None of this means charts are useless to humans. It means that, as raw material for a machine learning model that has to find a stable pattern, price history alone is a very thin diet.
Why news data is easier to work with
Now compare that to news. Here are six reasons why this kind of data is friendlier, and I’ll go through each one slowly.
1. It comes from outside the chart
A price chart is a closed loop. Past prices lead to present prices, which lead to future prices. Everything is happening inside the same bubble.
An economic announcement is different. It arrives from the outside, like a message from the real world. At 8:29 and 59 seconds, nobody on Earth knows whether the economy added a hundred thousand jobs or three hundred thousand. One second later, the figure appears on every screen. That is brand-new information, injected into the market, and no amount of chart analysis could have contained it.

For a machine, that matters. A pattern that starts with a real-world cause is much more likely to repeat than a pattern that comes from random wiggles.
2. It has a precise moment in time
Price flows continuously, with no natural starting point. News arrives at an exact second. That gives us something wonderfully useful: a clean “before” and “after”.
We can say: this is what the market looked like in the hour before the announcement. This is the moment it arrived. And this is what happened in the four hours afterwards. Each announcement becomes one neat example, with a beginning, a middle, and an end. That is exactly the format a learning machine likes. It’s like turning a never-ending film into a collection of short, labelled clips.
3. It comes with a built-in answer key
When you study the news, you get two numbers for free: what was expected, and what happened. Subtract one from the other, and you have the surprise, a single, measurable number that describes how shocking the news was.
Compare that with chart patterns, where you’d have to define what counts as a “head and shoulders”, or a “breakout”, and argue about it forever. With news, the key input is just arithmetic.
The course goes one step further. A surprise measured in jobs can’t be compared with a surprise measured in percentages. So the course converts every surprise into a common scale, answering one question: “how surprised should we be, compared with how surprised we normally are by this particular report?”
It’s a bit like adjusting for the size of the animal. An extra fifty kilograms on an elephant is a rounding error, while an extra five grams on a bee is a disaster. You have to measure each change against what’s normal for that creature.

4. You can explain why it works
This one is easy to overlook, but it’s a big deal for anyone who wants to trust their system.
With news, the logic is a story you can follow. If US jobs numbers come in stronger than expected, then the US central bank is more likely to keep interest rates high. Higher interest rates make the Dollar more attractive to investors. So money flows towards the Dollar, and the Euro-Dollar price falls.
Compare that with a model that says “buy when the fourteen-period indicator crosses a number”. If a machine learning model produces a signal, and you can’t explain it, you can’t tell the difference between a real edge and a lucky accident. With news, you can ask, “Does this make economic sense?” That sanity check is surprisingly powerful.
A simple way to picture the pipeline is to think about two banks facing each other across the street. Bank America pays 5% on savings, Bank Europe pays 1.5%. Where would you put your money? Wealthy investors will move their money to Bank America, but to do that, they first have to buy Dollars. That buying pressure pushes the Dollar up, and Euro-Dollar down. News about the economy changes what people expect interest rates to do, and that changes where money wants to go.
5. Big money moves slowly, and a robot doesn’t need to be fast
This is perhaps the most surprising finding behind the whole approach.
You’d think that the moment a number is published, the market would adjust in a single instant. And for small traders, it does. But the investors who really move currencies are enormous: pension funds, central banks, giant asset managers. Imagine a fund that needs to shift two billion dollars after a surprising report. If it dumped that order all at once, the price would run away from it, and it would lose millions in extra costs. So instead, it uses algorithms that slice the big order into thousands of tiny ones, and feed them into the market steadily, over a couple of hours.
Picture a speedboat on a lake and a giant container ship at sea. The speedboat can spin around in two seconds. The container ship needs miles of open water to make a turn. Retail traders are speedboats. The investors who steer currencies are container ships. And a container ship’s turn is slow enough to ride.

This means you don’t have to win a speed contest against machines that react in microseconds. You’re not competing with the first second. You’re studying what happens over the following hours, which is a game that a patient, well-prepared system can play.
6. The data is small, tidy, and organised
Price data comes in a never-ending stream. News data comes as a table. One row per announcement, with columns for what was expected, what happened, and when. That’s easy to inspect, easy to clean, and easy to check by eye.
There is a catch, though, and I’ll be straightforward about it. A table of news events is small. Over a decade, there are only a few hundred high-quality events that matter. That’s a tiny dataset by machine learning standards. Small data is more tempting to memorise than big data, so it has to be handled with a lot of care. We’ll come back to that.
“Easier” does not mean “easy”
If news data were truly easy, everyone would be doing it. They’re not, because hiding inside this tidy table are four traps, each of which can quietly ruin a project, and each of which looks harmless until it bites.
The first trap: the clock
Imagine you collect your news data from a website, which uses one time standard, and your price data from your broker, which uses another. Suppose they differ by two hours. Your records will say that the news arrived at one o’clock, but the broker’s chart will show that moment as happening two hours before the news. Now your model “learns” that the price moves before the news arrives. It looks like a talent for predicting the future. It’s actually a broken clock. And the problem gets worse, because the US and Europe change their clocks on different weekends, so for a few weeks every year, the gap between them shifts by an extra hour.

The second trap: rewritten history
Governments often revise their numbers weeks or months later. If you look at a free website today, you’ll see the corrected figure. But a trader on the day only saw the first, unrevised number. If you train your model on the corrected number, you’ve given it information that nobody had at the time. It’s like grading someone’s exam using the answer key they wrote after seeing the results.
The third trap: the imaginary spread
The spread is the small fee that a broker charges every time you trade, built into the gap between the buying and selling price. In calm markets, it’s tiny. But in the seconds after a big announcement, the banks that supply prices pull back, to protect themselves, and the spread can explode from under one pip to ten or twenty pips. A “pip” is the standard small unit of price movement in currencies, one hundredth of a percent. A simulation that assumes a fixed, tiny fee will make trading right at the news look wonderfully profitable. In the real world, you’d pay a heavy toll just to get in.
The fourth trap: peeking at the exam
If you keep adjusting your model while looking at the whole dataset, you’ll eventually find settings that fit the past perfectly, including its random quirks. That doesn’t mean the model has learned anything. It means that you, the researcher, have memorised the test. Honest research has to keep a block of data locked away, and only look at it once, at the very end.
These four traps are the reason that so many promising backtests collapse in live trading. And none of them is about being “mathematically gifted”. They’re about knowing where to look.
How the data travels through the course
So how do you turn raw news and raw prices into something a machine can learn from, without falling into those traps? In the course, the data goes on a journey with six stops. I’ll describe them in plain terms, without giving away the workings.

- Stop one: collect. Everything begins by gathering ten years of economic announcements and five-minute price data, directly from the same source, so that they share one clock. The goal is simple: get both the cause and the effect, on a single timeline, with nothing rewritten and nothing guessed.
- Stop two: clean. The raw calendar has tens of thousands of entries, and most of them are useless for our purpose. Some have no exact time. Some are speeches with no numbers. Some are minor reports that have never moved a price. Some arrive at the same second as three other reports. In this stop, the data goes through a series of filters, and the great majority of it is removed. What remains is a few thousand clean, precisely timed events, each one matched to the price movement around it. It feels harsh to throw away so much, but a small, honest dataset beats a huge, messy one.
- Stop three: test. Now we ask a tough question about every type of announcement: does it genuinely move the price in a way that’s large and consistent enough to be worth trading? This stage works a bit like a courtroom. Each indicator is innocent of having an effect until the evidence says otherwise. Most are dismissed. A small group of strong catalysts remains.
- Stop four: prepare. Here, the raw numbers are turned into a set of clues that mean the same thing in any year. A price of 1.38 in 2014 and 0.96 in 2022 look completely different to a machine, even if the market is doing the same thing. So we convert everything into relative measures: how big was the surprise, how calm was the market beforehand, how did the first five minutes react. And we also decide, very carefully, what counts as a winning trade, in a way that respects stop-losses and costs, instead of just checking whether the price ended higher.
- Stop five: learn. Only now does a machine learning model come into the picture. It is deliberately kept small, because with only a few hundred good examples, a big model would just memorise them. It is trained to be cautious, tested only on years it has never seen, and compared honestly against simpler methods.
- Stop six: trade. Finally, the trained model is moved into the trading platform, where it has to rebuild the same clues in real time, apply the same rules, and prove that the version running on your screen gives exactly the same answers as the one that was tested.
Notice what’s happening. Out of six stops, only one is about the learning model. The other five are about making sure that what the model learns from is trustworthy, and that what it does is realistic. That ratio isn’t an accident. It reflects a rule that professional quantitative teams are known to follow: most of a model’s success is decided before the model is built.
What the study revealed
Along the way, the analysis uncovered some findings that surprised us. I’ll share the main ones, with the usual caution: these come from one currency pair, over one period of history, and no one should read them as promises about the future.
Finding 1: Most of the economic calendar is decoration
Across the full set of 137 recurring indicators, only about a dozen could show an effect that was both statistically convincing () and large enough to pay for trading costs. The rest, including some famous names, were indistinguishable from random wandering. In other words, most of those red folders on the economic calendar look important, but they aren’t important enough to trade.

Finding 2: The move after the news doesn’t bounce back, it keeps going
Many traders believe that news spikes always snap back, so they try to fade them. The study found that, for strong surprises, the average price path keeps drifting in the same direction for up to about four hours, before it flattens out. That fits with the container ship idea: large institutions are still repositioning over . It also means that betting against a decisive surprise has often been the wrong side of the trade.

Finding 3: The first seconds are the most expensive place to be
At the instant of an announcement (), the average spread in the study jumped to about eleven and a half pips, compared with a normal level of under one pip. Within five minutes (), it had settled back to a small fraction of that. And during that first five-minute candle, the average move was only a few pips, so the large majority of the total drift was still to come.
The implication is surprising for anyone who thinks news trading is about speed: the best moment to act was often not the first one. By waiting for the dust to settle, you pay much less in costs, and you still keep most of the move.

Finding 4: A small surprise is no surprise at all
When the study grouped events by how big the surprise was, it found three zones. Below a certain size (about three-quarters of a standard deviation, ), the market barely reacted. Prices just shuffled around within the cost of trading. Above that threshold (), bigger surprises produced bigger moves. And beyond a very large size (), the reaction flattened out, because dealers widened their spreads and risk limits capped how much institutions could add.
The practical message: most releases that look “slightly better” or “slightly worse” than expected are not trades. They’re noise wearing a suit.

Finding 5: When two signals disagree, the market gets confused
Sometimes a report’s headline number looks strong, while a revision to the previous month’s number quietly says that the economy was weaker than first reported. When the headline and the revision pointed in opposite directions, the study found that most of those events simply chopped sideways, and the average drift collapsed by more than half. Fast algorithms trade the headline, slower investors trade the revision, and the two groups fight each other.
Finding 6: About half of high-impact events lead nowhere
This is perhaps the most important finding. Even among the carefully filtered, important events, roughly half produced no tradeable trend at all, within the time window we allowed. They ended up in a tight range, or whipsawed in both directions.
That changes the meaning of a good model. Its most valuable job isn’t predicting buy or sell. It’s recognising the events where there’s nothing to do, and keeping the account out of them. The amateur thinks success means being right on every announcement. The professional knows that success means choosing the right announcements.
Finding 7: Fixed stop-losses are a quiet killer
Many traders pick round numbers: “ten pips stop, twenty pips target”. The study measured how far winning trades typically dipped against their direction before eventually succeeding, and found that this dip was usually about one and a half times the market’s own measure of volatility at that moment (). A stop that’s tighter than that gets triggered by ordinary noise, before the real move arrives. And what counts as “tight” changes from calm days to wild ones, which is why a fixed number of pips doesn’t work.
This led to a simple structure where the target is bigger than the stop, and both scale with how violent the market is that day. With that structure, the mathematics says you don’t have to win most of your trades to break even:
In the study’s setup, a win rate of about thirty-eight percent () was enough to cover costs, before any profit. That isn’t a promise of profit. It’s a statement about arithmetic, and it explains why a lower win rate isn’t automatically a bad sign.
Finding 8: The honest results were modest
Here’s where I want to be especially frank, because this is where most articles on this subject start overselling.
When the machine learning model was tested on years it had never seen, using realistic costs, the results were mixed. In two of the three test years, both the machine learning model and a simpler baseline model lost money. In the third year, the machine learning model did well, but it only made a handful of trades, far too few to prove anything. Over the whole test period, the simpler model actually earned slightly more than the neural network.
Why share that? Because it’s the most useful result of all. The real finding isn’t that a neural network beats the market. It’s that you can test an idea honestly, with no peeking, no imaginary costs, and no rewritten history, and see for yourself how thin the real edge is. A method that tells you the truth is worth far more than one that tells you what you want to hear.
If someone shows you a trading robot with a perfect, smooth, upward-sloping curve, ask them one question: “How did you test it?” The answer will tell you almost everything.
“But I’m not good at maths”
This is the objection I hear most, and it deserves a straight answer.
The maths in this approach is, honestly, mostly arithmetic. Subtract the forecast from the actual figure. Divide by a typical size. Add up a few numbers. A neural network, at its core, is nothing more than multiplying and adding numbers, bending the result through a curve, and repeating that thousands of times. You can do one calculation of it by hand, with a pencil, in two minutes.
What really matters is not the difficulty of the sums. It’s careful thinking. Which clock is this on? Could I have known this at the time? What would this cost me in the real world? Those are questions anyone can learn to ask. They need patience and curiosity, not a degree.
And when a formula does appear, the useful way to meet it is in three steps: first the idea in everyday words, then a small example with real numbers, and only then the symbols. Symbols are shorthand for something you already understand.
What this approach can’t do
For balance, here are some honest limits:
- It only works around scheduled news. Most hours of the trading week, there’s no announcement, and this approach has nothing to say.
- It requires patience. There are only a few dozen meaningful events in a year, so the number of trades is small.
- It isn’t immune to changing times. The market’s behaviour in a low-interest-rate world differs from its behaviour in a high-inflation one, and a model has to keep proving itself.
- And, of course, trading carries real risk. You can lose money, costs are real, and nothing in this article is financial advice or a promise of profit.
The gap between understanding and building
Having read this far, you now understand the main ideas: that news data is a better raw material than price charts, why the surprise matters more than the number, why the clock, the revisions, the spread, and the exam all need to be handled carefully, and why honest testing matters more than clever models.
Here’s the thing, though. Understanding why something works and actually building it are two very different skills. The traps we talked about don’t announce themselves. They hide in details: a timestamp that’s off by one candle, a revision that was copied the wrong way, a split of the data that looks fair but leaks a few hours of future. You only really learn to see them by working through them, one step at a time, with real data, and watching what happens when you get them wrong.
That’s the part of the journey the course is designed to walk through, step by step, with every formula explained and every result shown, including the ones that don’t flatter the method. If the questions in this article made you curious about how each stop on the journey actually works, that’s what the course is for. And if you decide to just keep these ideas and apply them yourself, you’ll still be a more careful trader than you were an hour ago.
Whatever you choose: be sceptical of every backtest, including your own, and remember that the market gets to vote last.
Trading foreign exchange on margin carries substantial risk and is not suitable for all investors. You can lose some or all of your invested capital. This article is published solely for educational and research purposes. It does not constitute investment advice, financial guidance, or a solicitation to trade live capital. Past backtested performance is no guarantee of future market results.